
Every sensor we build, reporting to one screen
Climate, light, and nutrient instrumentation from our own greenhouses and plant factory, brought together in a single control view. Switch zones, switch parameters, and watch a tropical growing day play out.
A day in a tropical growing house
The clock advances on its own. Pause it, pick a different zone, or switch the chart to another parameter to see how the readings move together.
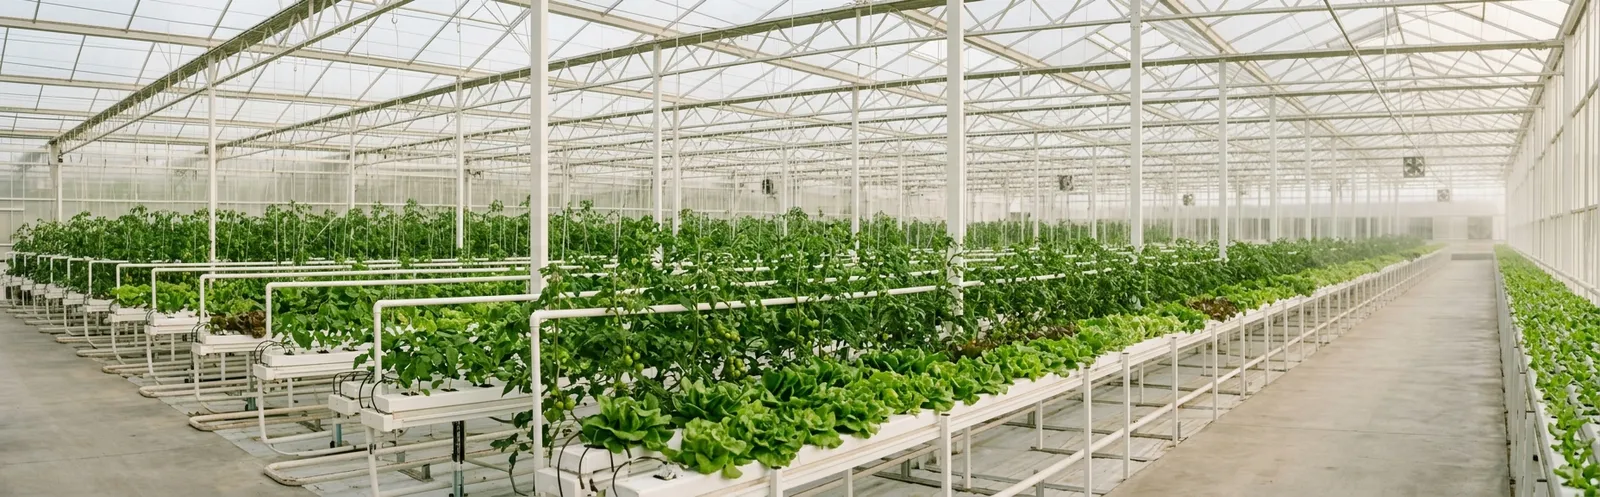
4 of 4 rooms are inside their target envelope
Vapour pressure deficit · GH-1 Bay A
Solid line is measured to the playhead. The dashed continuation is the modelled rest of the day.
Root zone
Mixing tank · 2,000 LLight and canopy
Room comparison
4 of 4 rooms active| Room | Crop | Air | VPD | EC | Status |
|---|---|---|---|---|---|
| Beefsteak tomato | 28.0 °C | 1.15 kPa | 2.67 | Active | |
| Butterhead lettuce | 23.5 °C | 0.87 kPa | 1.77 | Active | |
| Sweet basil | 23.2 °C | 0.82 kPa | 2.06 | Active | |
| Mixed seedlings | 24.9 °C | 0.44 kPa | 1.39 | Active | |
| Strawberry, cultivar trial | - | - | - | Offline |
Actuators
4 of 7 runningResource use today
Since midnightMeters read against the day's planned budget. Nutrient stock counts down from a full tank rather than up.
Event log
View all- Greenhouse 1 · Bay A
VPD above 1.3 kPa around solar noon, screen closed to 40 percent
18 min ago - Plant Factory · Rack A
pH corrected from 6.31 to 5.84, 180 mL acid dosed
42 min ago - Greenhouse 2 · Trial bay
Room offline, controller in maintenance since 06:10
3 h ago - Mixing tank
Dissolved oxygen recovered to 7.4 mg/L after chiller cycle
4 h ago
Demonstration data. The readings are generated from physical models of a tropical growing day, not streamed from the research facility. Vapour pressure deficit is computed from the air temperature and humidity shown beside it, and the daily light integral is the running integral of PPFD, so the relationships between parameters behave exactly as they do in a real house.
What we measure, and why it earns its place
A dashboard is only worth the decisions it changes. Each parameter below is on the screen because a grower acts on it, not because the sensor was cheap to add.
Aerial environment
What the canopy is breathing, feeling, and being lit by.Air temperature°C
Sets the pace of every process in the crop, from photosynthesis to fruit set. In the tropics the problem is almost always shedding heat, not adding it.
Shielded aspirated T/RH probe, one per bay at canopy height
Relative humidity%
On its own it says little, but paired with temperature it gives VPD. Sustained high humidity is also the opening that fungal disease waits for.
Capacitive RH element in the same aspirated probe
Vapour pressure deficitkPa
The number that actually drives transpiration, and the one we steer on. Too low and the crop stops pulling water and calcium, too high and it closes its stomata and stalls.
Computed from air temperature and humidity, not measured directly
Carbon dioxideppm
Once light and temperature are right, CO2 is usually the next limit on photosynthesis. A closed house draws it down fast in the morning.
NDIR CO2 sensor, auto-baselined weekly
PPFDµmol/m²/s
Photosynthetic photon flux density: how much usable light is landing on the canopy right now, in the 400 to 700 nm band the crop can actually use.
Quantum PAR sensor at canopy level, plus a fixed reference sensor
Daily light integralmol/m²/d
The day's total light, the figure that decides yield. Running DLI is what tells you whether to top up with lamps before the day closes.
Integrated from the PAR sensor across the photoperiod
Leaf temperature°C
Leaf minus air temperature is an early read on whether the crop is still transpiring. A leaf running hot has usually already closed down.
Infrared canopy thermometer, one per bay
Root zone
The nutrient side, measured inline rather than by hand once a day.pH
Decides which nutrients the root can actually take up. Drift above 6.5 locks out iron and manganese long before anything shows in the leaf.
Inline glass pH electrode with automatic acid dosing
Electrical conductivitymS/cm
A proxy for how concentrated the feed is. Rising EC between doses means the crop is drinking faster than it is eating, which is a climate signal as much as a nutrition one.
Toroidal EC probe on the return line, temperature compensated
Dissolved oxygenmg/L
Roots respire, and warm water holds less oxygen. In a tropical root zone this is the quiet failure: yield drops well before the roots look wrong.
Optical DO probe in the mixing tank
Nutrient temperature°C
Sets the oxygen ceiling and the pace of root disease. Holding the solution cool is often cheaper than cooling the whole air volume.
PT1000 probe in the tank, second probe on the delivery line
Irrigation flowL/min
Confirms that a dosing event actually reached the crop. Flow that reads zero during a scheduled shot is a blocked line, not a quiet plant.
Inline paddle flow meter per irrigation valve group
Instruments we built, and maintain ourselves
The dashboard is the visible end of a stack that starts at the probe. Everything on it is running in our own facility, which is where the calibration routines and failure modes were learned.
Aerial sensing
The canopy environment: what the crop is breathing, feeling, and being lit by.
- Aspirated air temperature and relative humidity at canopy height
- Vapour pressure deficit computed live from both
- NDIR carbon dioxide, with weekly baseline correction
- Quantum PAR sensor for PPFD, integrated into a running DLI
- Infrared leaf temperature for early stomatal closure
Root zone sensing
The nutrient side, measured inline rather than by hand-held meter once a day.
- pH and electrical conductivity on the return line, temperature compensated
- Optical dissolved oxygen in the mixing tank
- Nutrient temperature at tank and at delivery
- Flow per valve group, so a dosing event is confirmed, not assumed
Weather station
The outdoor boundary condition, because a tropical house is always answering the sky.
- Air temperature, humidity, and barometric pressure
- Global solar radiation in W/m² and outdoor PAR
- Wind speed and direction for vent safety interlocks
- Tipping-bucket rainfall, logged per minute
Control and logging
The layer that turns readings into actions and keeps the record a trial can be written from.
- Local controller keeps running when the internet does not
- Setpoint recipes per crop and growth stage
- Alarm rules on band, on rate of change, and on sensor silence
- Full-resolution history exported as CSV for analysis
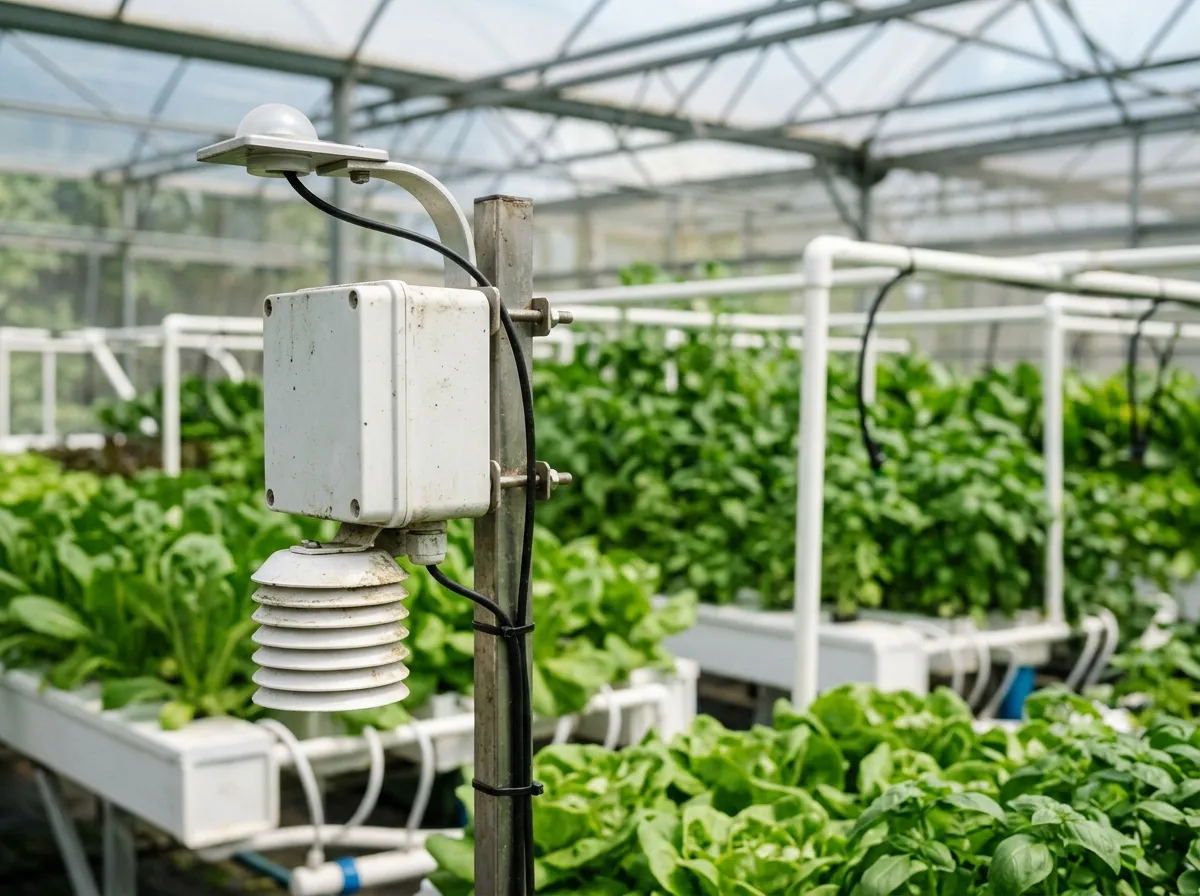
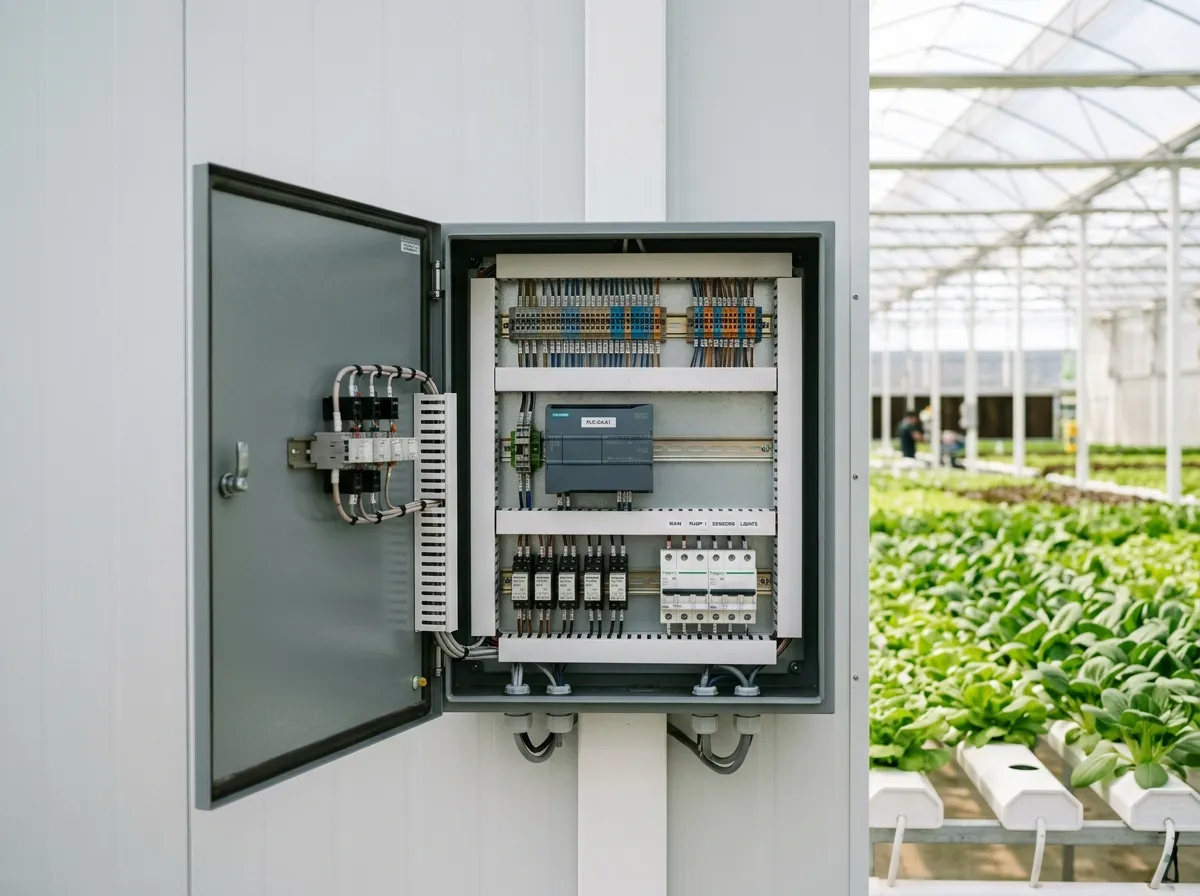
Designed for a house with an unreliable connection
Control stays local
The controller holds the setpoints and keeps actuating whether or not the internet is up. The dashboard is a window onto it, not the thing keeping the crop alive.
Buffered upload
Readings are logged at full resolution on site and backfilled when the link returns, so a dropout leaves a gap in the view, never in the record.
Calibration is tracked
Every probe carries its last calibration date and drift. A sensor past due is flagged on the screen rather than quietly trusted.
The data is yours
Full-resolution history exports as CSV for analysis in R, Python, or a spreadsheet. A trial should be writable from the log without asking us for it.
Want this on your own house?
Tell us what you are growing and what you already have installed. We will tell you which parameters are worth instrumenting first, and which ones can wait.